
VolcanoPlotR is a way to generate nice volcano plots from MaxQuant data.
Installation
Install the development version of VolcanoPlotR:
# install.packages("pak")
pak::pak("quantixed/VolcanoPlotR")
Example
With a MaxQuant proteinGroups.txt placed in a Data directory, you can run the following code to generate a volcano plot:
You will be asked which groups you want to compare. Proteins enriched in Group1 will be towards the right of the plot and those enriched in Group2 will be towards the left.
An example file is included in the package, so you can run the following code to see how it works:
library(VolcanoPlotR)
# get the path to the proteinGroups.txt file included in the package
filepath <- system.file("extdata", "proteinGroups.txt", package = "VolcanoPlotR")
# get the filename fromt the path
filename <- basename(filepath)
# get the directory name
filedir <- dirname(filepath)
# run the automated procedure we will also tell it which groups to compare so
# we don't have to select them interactively
workflow_maxquant(file = filename, datadir = filedir,
                  group1 = "WT", group2 = "Control")
#> Using specified groups: WT versus Control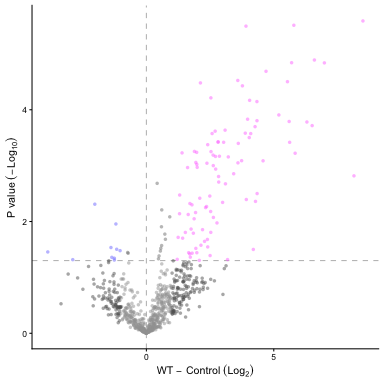
See the vignettes for more information.
Notes
VolcanoPlotR is a port of VolcanoPlot to R.