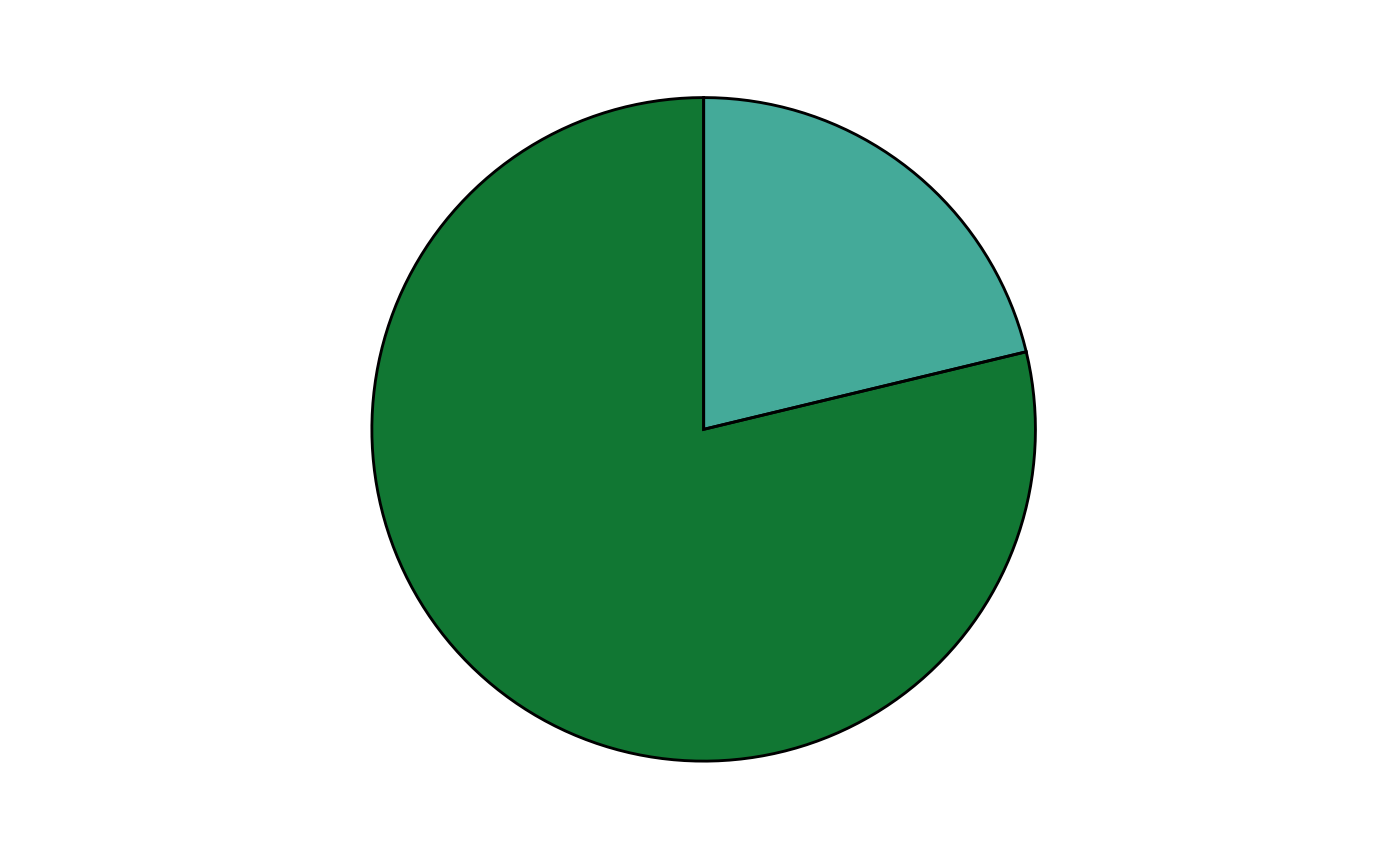
The function pie_maker creates a pie chart using ggplot2.
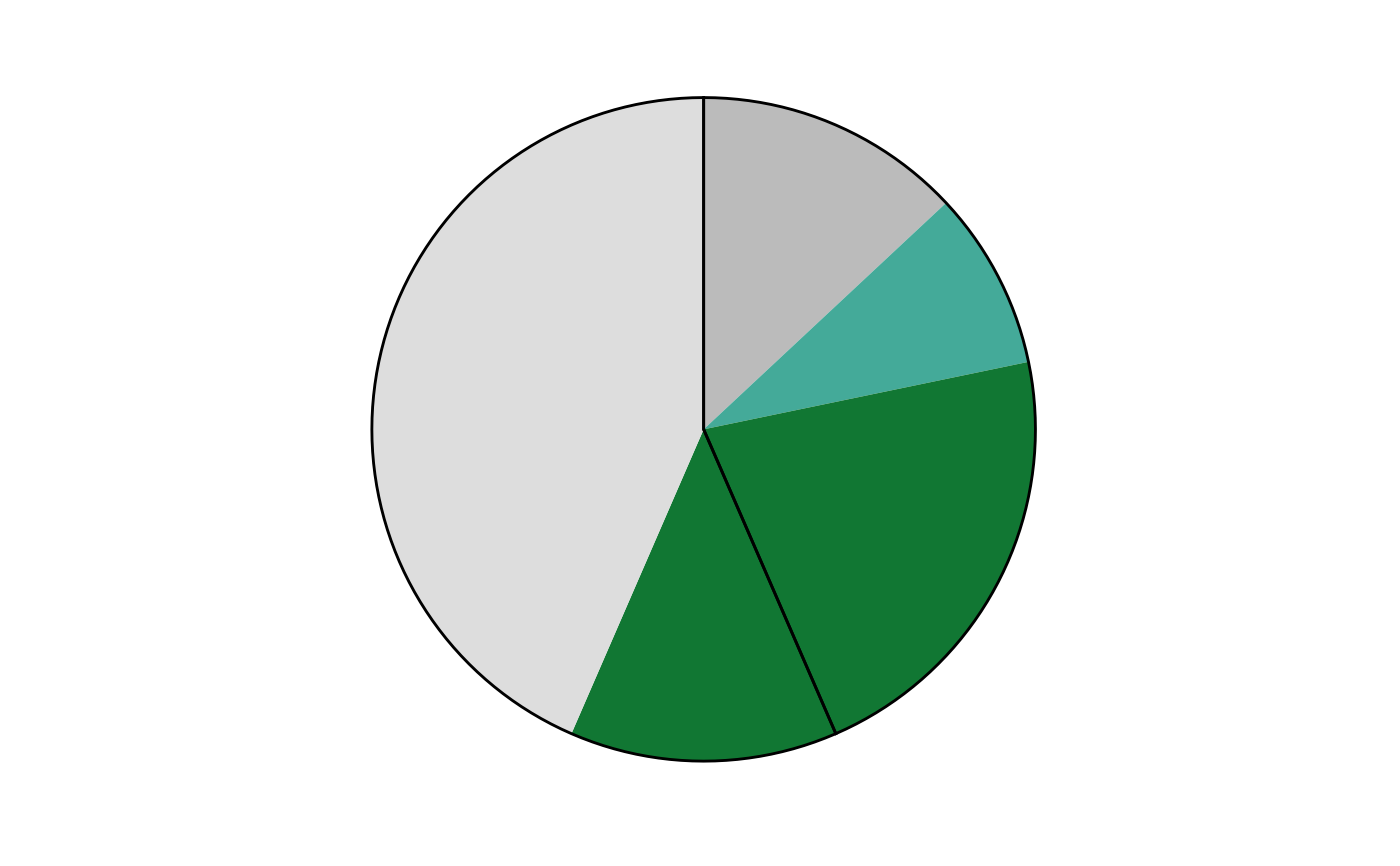
It takes two vectors of values and optionally a
second vector of values to create a pie chart with two layers.
Arguments
- x1
A numeric vector containing the values for the first layer of the pie chart.
- cols
A character vector containing the colors for the slices of the pie chart.
- x2
An optional numeric vector containing the values for the second layer of the pie chart.
- label
An optional character string to be used as the title
- ...
Currently not used.