Current limitations
There are some limitations to SuperPlotR. This vignette covers them and offers solutions where possible.
Facetting
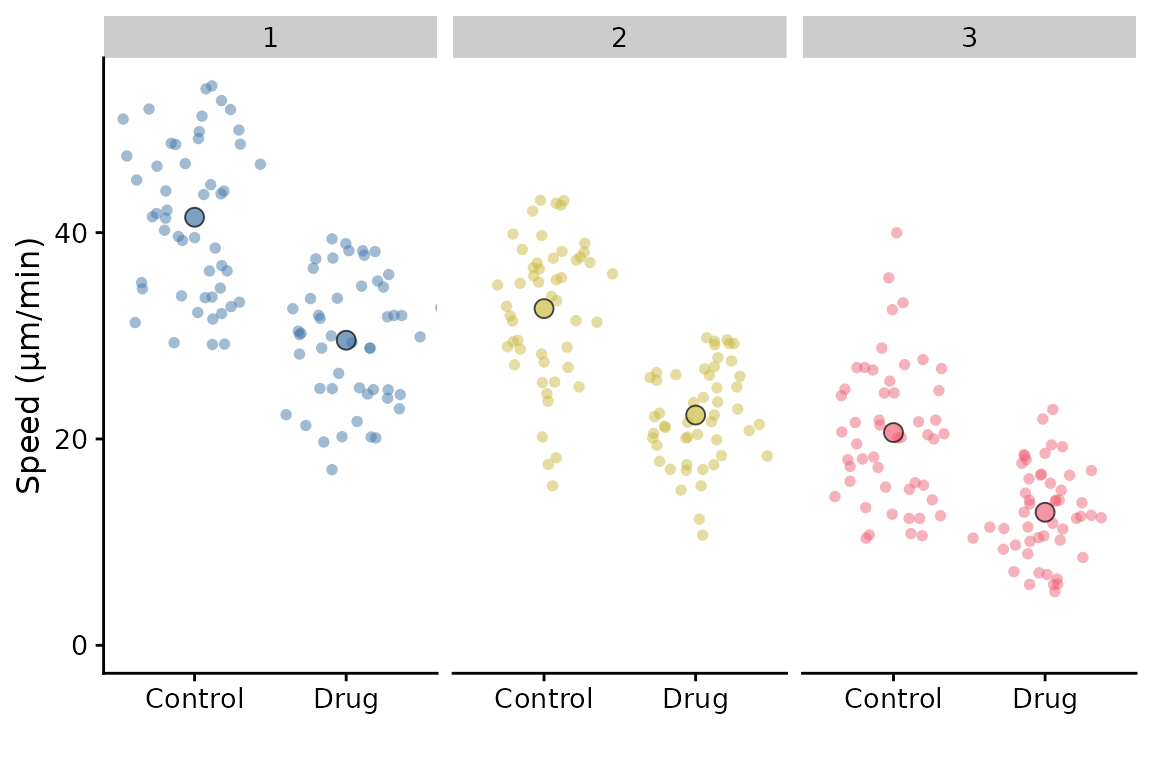
Facetting is partially supported. In the simple scenario of facetting by replicate, you can do this:
library(SuperPlotR)
library(ggplot2)
p <- superplot(lord_jcb, "Speed", "Treatment", "Replicate",
               ylab = "Speed (µm/min)")
p + facet_wrap(~Replicate)
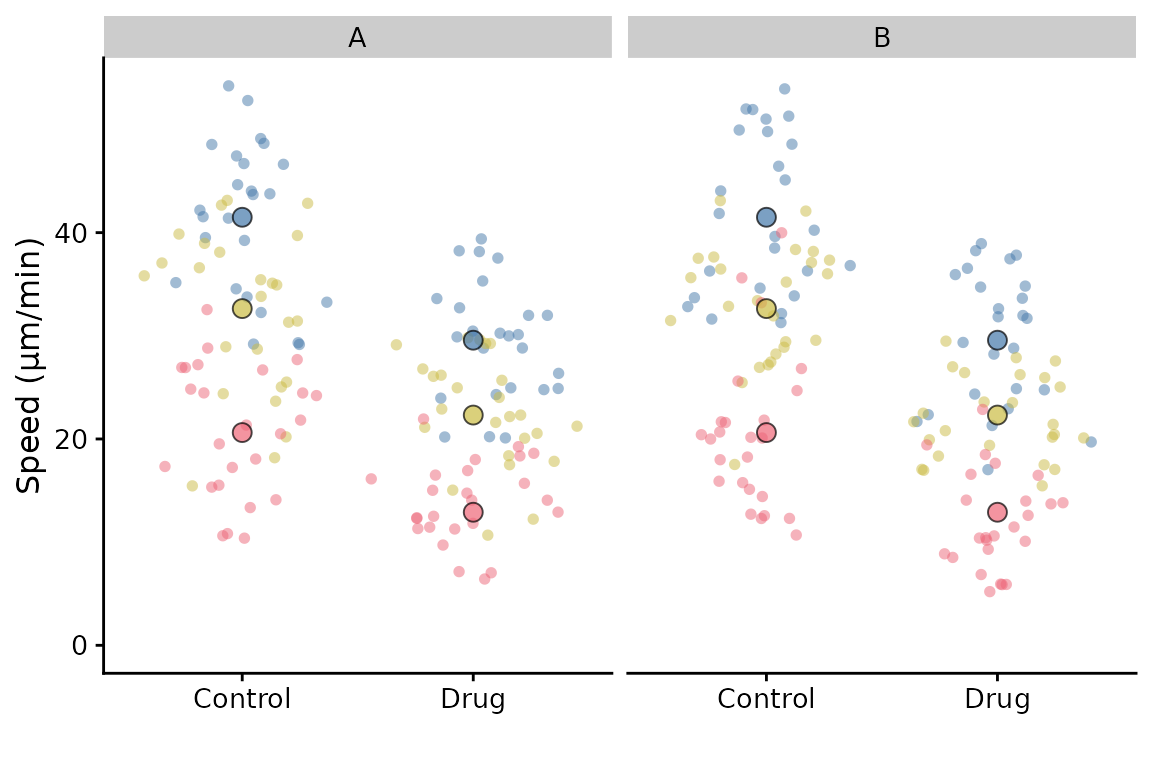
If we had another variable that we wished to facet by, then facetting by this variable is possible, but with a limitation: The summary points will remain as the replicate summary and therefore will be the same for each facet. This may not be what you want.
df <- cbind(lord_jcb, other = rep(c("A", "B"), 150))
p <- superplot(df, "Speed", "Treatment", "Replicate", ylab = "Speed (µm/min)")
p + facet_wrap(~other)
Solution: The best way to do achieve “facetting” currently (and have the correct summary points) is to make a SuperPlot for each variable, i.e. after filtering the data frame for A and B, and then combine them using patchwork or similar package.
Conditions and Replicates are categories
If you have a dataset where the conditions and replicates are numeric, SuperPlotR converts them to character for plotting. This is the intended behaviour for a SuperPlot.
Currently, if your data has Conditions that are numeric, for example time points, and these are unevenly spaced, e.g. 0, 1, 3, 9 hours; then these will appear evenly spaced on the x-axis. This is a limitation of the current implementation. Raise an issue if you would like this to be changed.
Adding statistics
Adding p-values or stars to the SuperPlot is currently not supported due to the number of different ways that users may wish to add them. However, it is possible to add them manually to the SuperPlot object after it has been generated.
SuperPlotR will do statistical testing for you (in a simple way) but
is turned off by default. You can turn it on by setting
stats = TRUE in your call to superplot().
p <- superplot(lord_jcb, "Speed", "Treatment", "Replicate", stats = TRUE)
#> Performing t-test
#>
#>  Welch Two Sample t-test
#>
#> data:  x and y
#> t = 1.2907, df = 3.8128, p-value = 0.2695
#> alternative hypothesis: true difference in means is not equal to 0
#> 95 percent confidence interval:
#>  -11.91888  31.89283
#> sample estimates:
#> mean of x mean of y
#>  31.58355  21.59657
Four types of statistical tests are available: t-test, Wilcoxon rank
sum test, ANOVA and Kruskal-Wallis test. Select between these options by
setting stats_test to one of the following:
"para_unpaired" (default), "para_paired",
"nonpara_unpaired" or "nonpara_paired".
If the number of conditions is two, these options result in:
-
"para_unpaired": t-test -
"para_paired": paired t-test -
"nonpara_unpaired": Wilcoxon rank sum test a.k.a Mann-Whitney U test -
"nonpara_paired": Wilcoxon signed rank test
If the number of conditions is greater than two, these options result in:
-
"para_unpaired": ANOVA followed by Tukey’s HSD test -
"para_paired": Repeated measures ANOVA -
"nonpara_unpaired": Kruskal-Wallis test -
"nonpara_paired": direction to perform a Friedman test
Returning to the example data, in the Lord et al. paper they perform
a paired t-test on the data. We can do this in SuperPlotR by setting
stats = TRUE and stats_test to
"para_paired".
p <- superplot(lord_jcb, "Speed", "Treatment", "Replicate", stats = TRUE,
               stats_test = "para_paired")
#> Performing t-test
#>
#>  Paired t-test
#>
#> data:  x and y
#> t = 8.1741, df = 2, p-value = 0.01464
#> alternative hypothesis: true mean difference is not equal to 0
#> 95 percent confidence interval:
#>   4.730053 15.243899
#> sample estimates:
#> mean difference
#>        9.986976
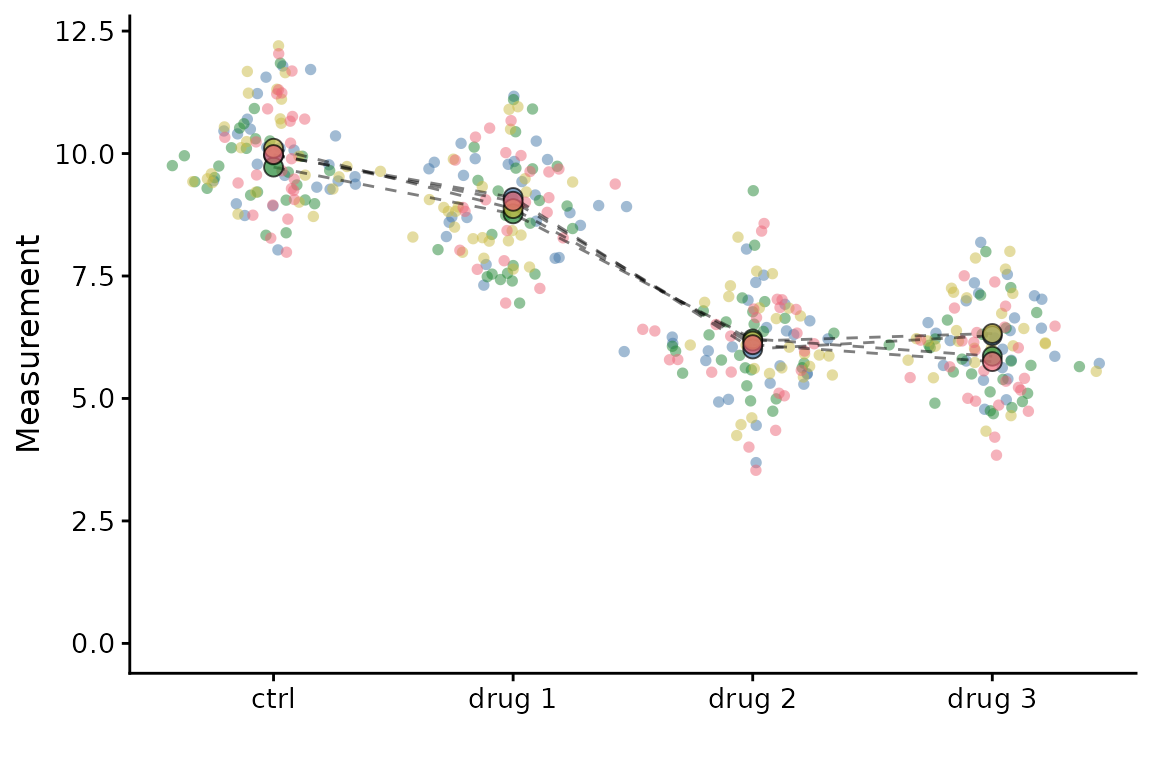
As a further example, we will generate some test data with four treatments.
set.seed(123)
example <- data.frame(meas = rep(rep(c(10, 9, 6, 6), each = 25), 4) + rnorm(400),
                      cond = rep(rep(c("ctrl", "drug 1", "drug 2", "drug 3"), each = 25), 4),
                      expt = rep(c("exp1","exp2","exp3","exp4"), each = 100))
superplot(example, "meas", "cond", "expt", linking = TRUE,
          stats_test = "para_unpaired")
