Making non-SuperPlots - FlatPlots
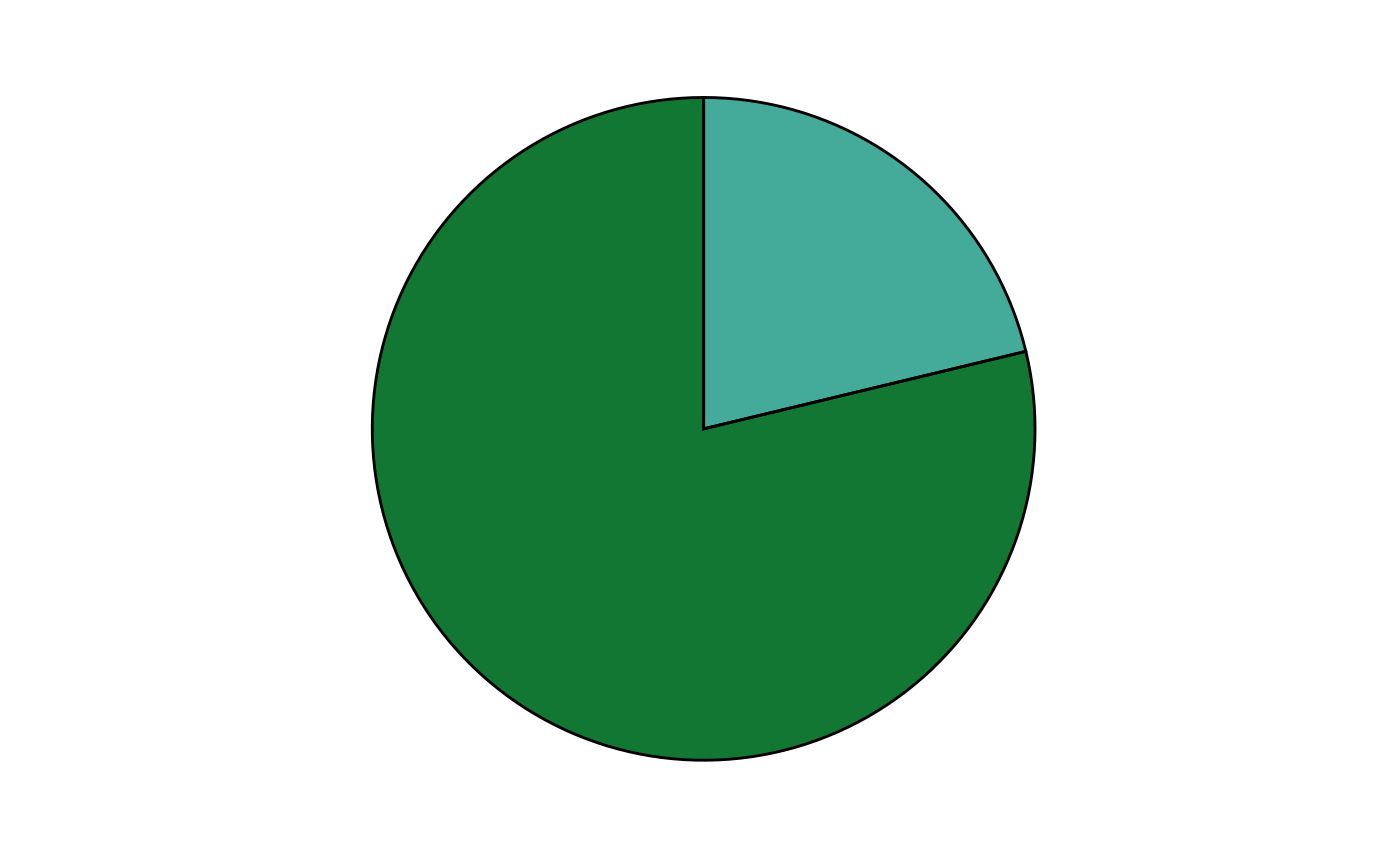
For convenience, SuperPlotR also provides a function to make pie
charts. Called pieplot(), it takes a vector of values and a
vector of colours, and returns a pie chart using ggplot2.
It can also take a second vector of values to create a pie chart with
two layers.
pieplot(x1 = c(50 - 20, 20, 80, 180 - 80),
        cols = c("#bbbbbb", "#44aa99", "#117733", "#dddddd"),
        x2 = c(100, 130))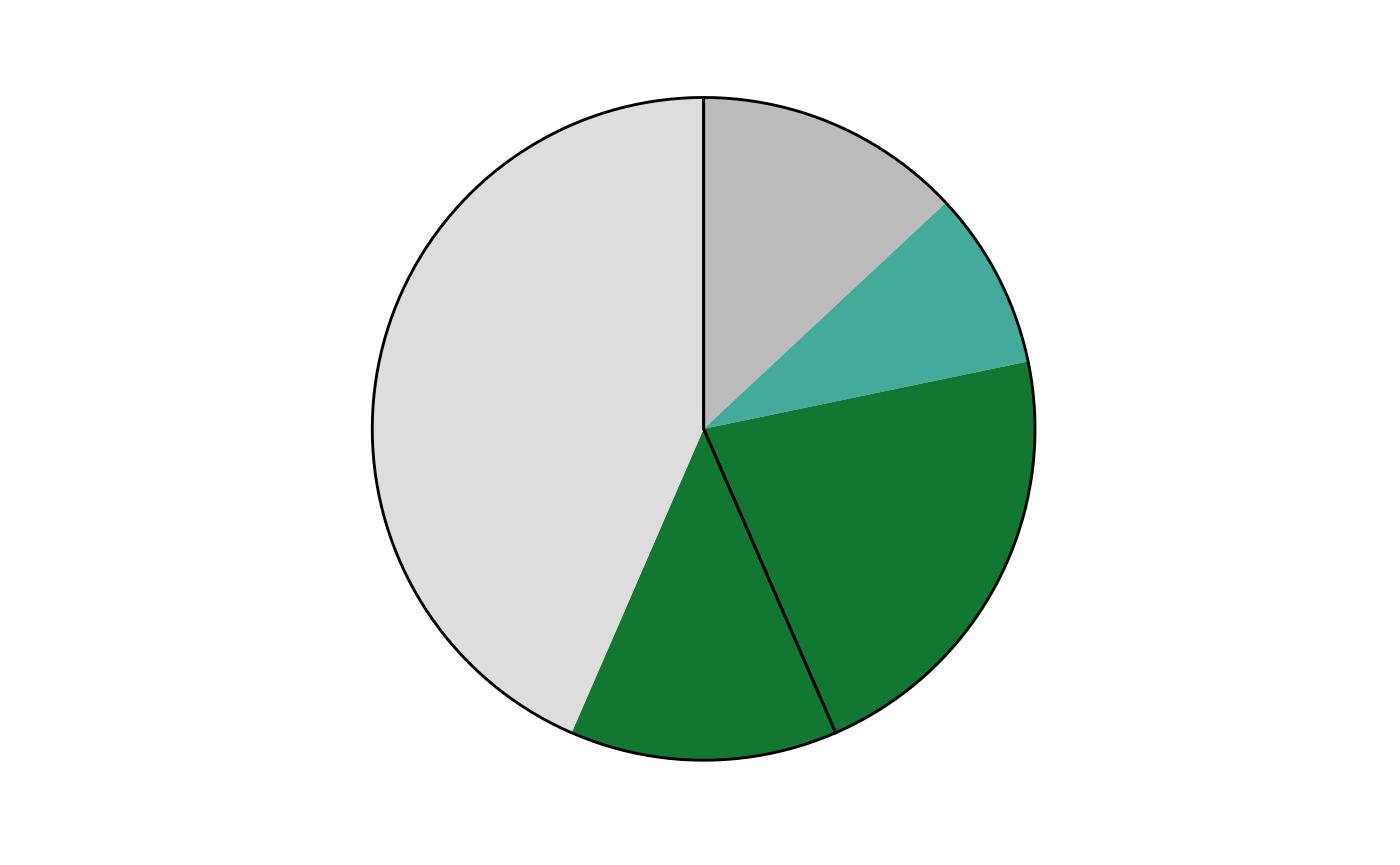
The cols argument should be a character vector of
colours, which can be hex codes or one of our lab’s publication colour
palette. The function will convert the colours to a format that
ggplot2 can use.
pieplot(x1 = c(50 - 20, 20, 80, 180 - 80),
        cols = c("#bbbbbb", "rl_blue", "#117733", "lavender"),
        x2 = c(10, 13), label = "Example Pie Chart")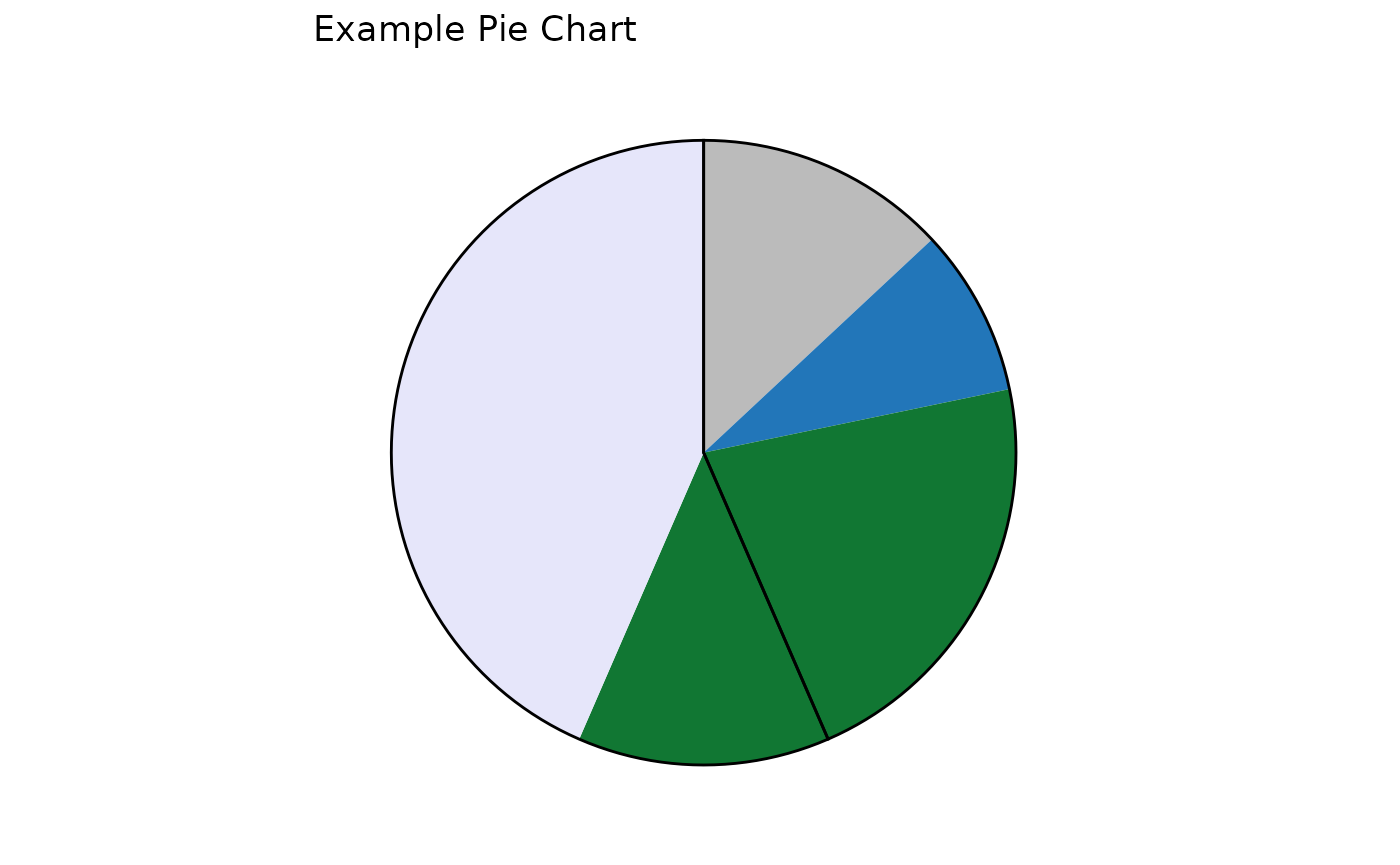
Note that the values for the second pie chart layer do not have the same as the first layer. The function will automatically scale the second layer.